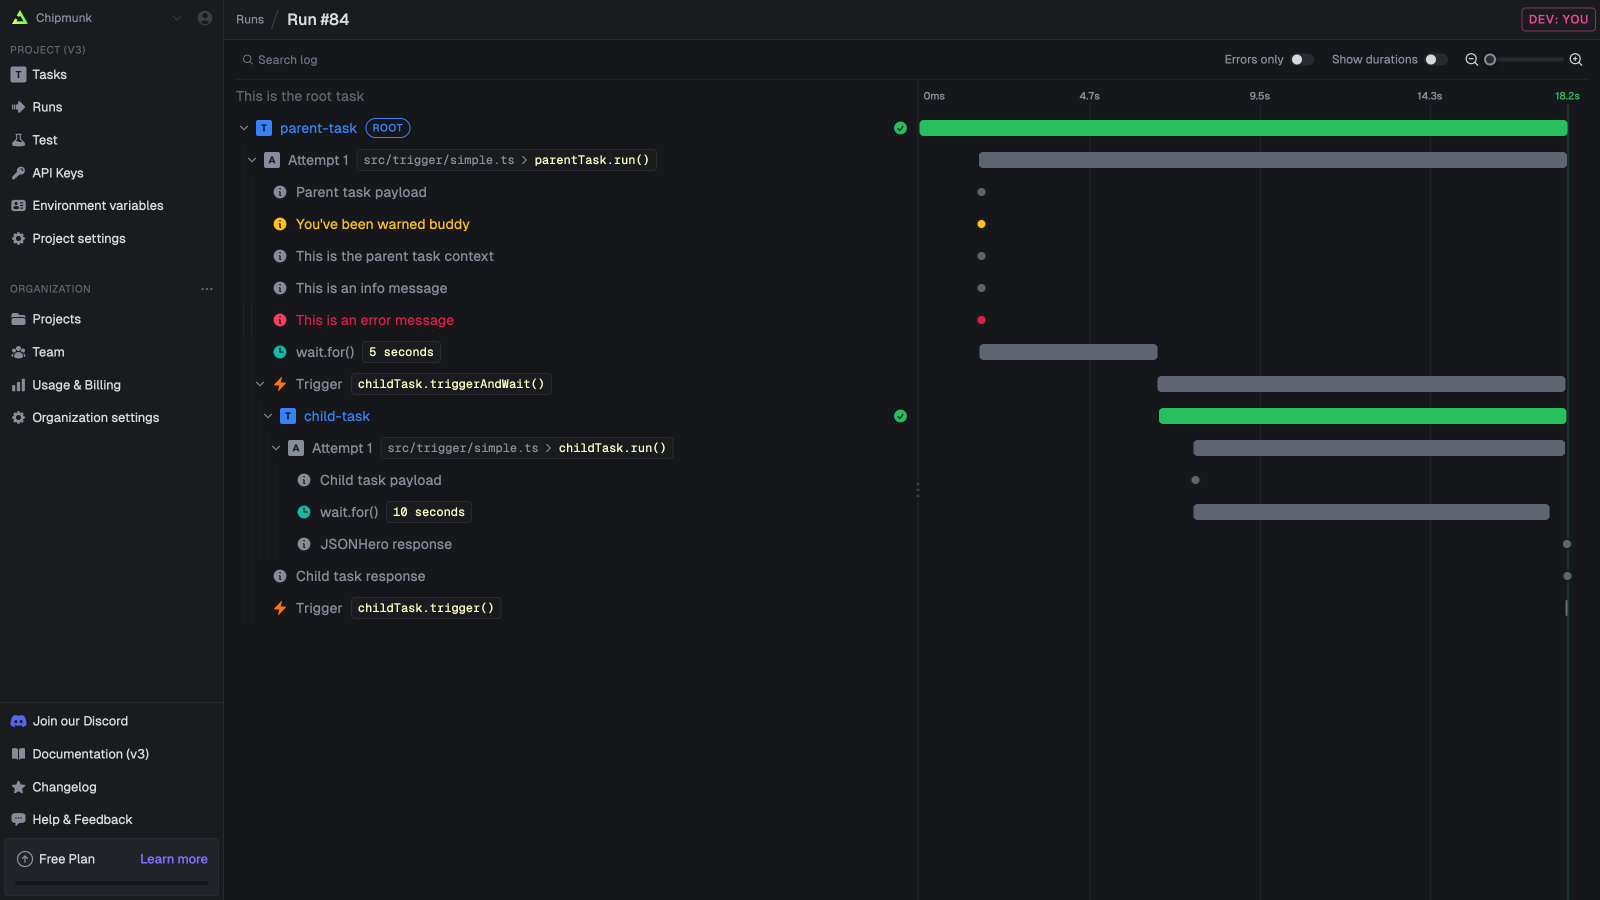
 The run log shows you exactly what happened in every run of your tasks. It is comprised of logs, traces and spans.
Logs
You can useconsole.log(), console.error(), etc as normal and they will be shown in your run log. This is the standard function so you can use it as you would in any other JavaScript or TypeScript code. Logs from any functions/packages will also be shown.
logger
We recommend that you use ourlogger object which creates structured logs. Structured logs will make it easier for you to search the logs to quickly find runs.
/trigger/logging.ts
Tracing and spans
Tracing is a way to follow the flow of your code. It’s very useful for debugging and understanding how your code is working, especially with long-running or complex tasks. Trigger.dev uses OpenTelemetry tracing under the hood. With automatic tracing for many things like task triggering, task attempts, HTTP requests, and more.Automatic instrumentation
| Name | Description |
|---|---|
| Task triggers | Task triggers. |
| Task attempts | Task attempts. |
| HTTP requests | HTTP requests made by your code. |
| OpenAI | OpenAI SDK calls. |
Add custom traces
If you want to add custom traces to your code, you can use thelogger.trace function. It will create a new OTEL trace and you can set attributes on it.